Graphing Calculator
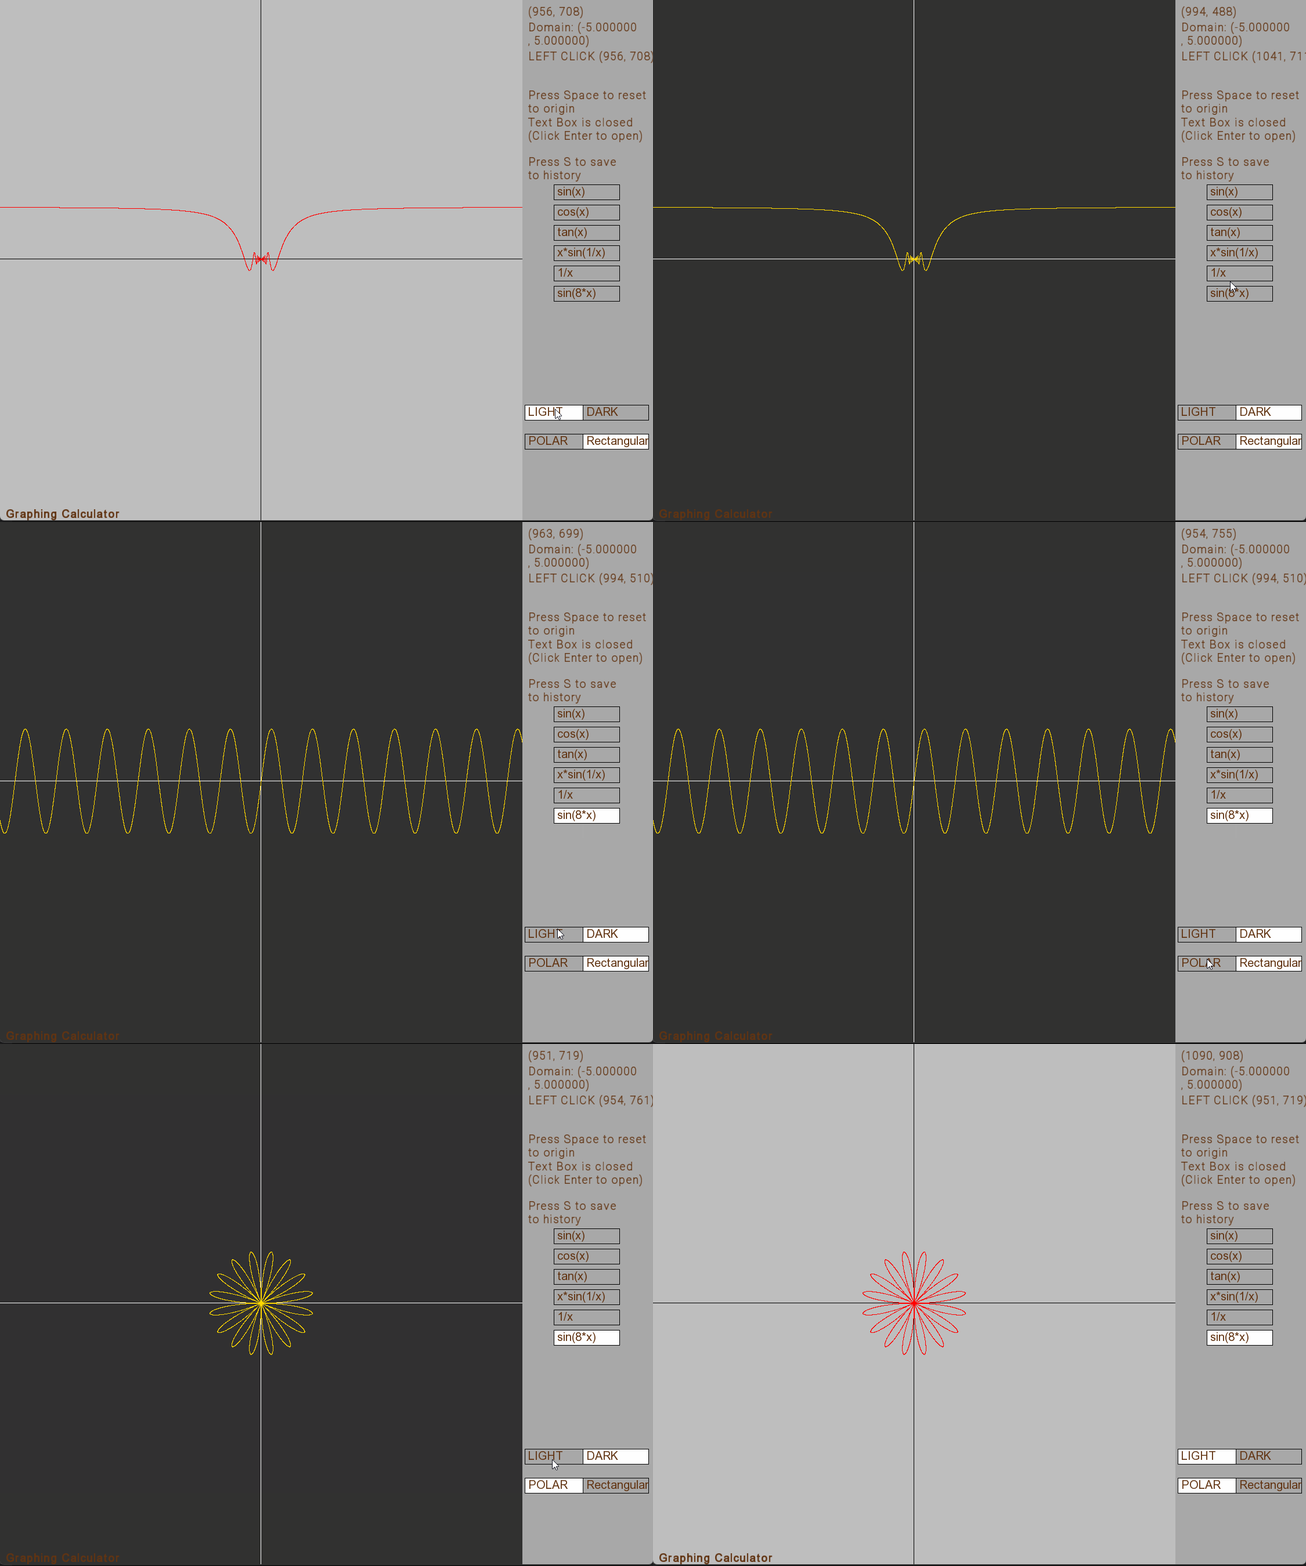
This project was created using C++ and SFML graphics libraries. This calculator is designed to generate the rectangular and polar graphs.

Graphing Calculator Demo
How to use
- Press enter to put in your desired equation and click enter again to generate the graph.
- Move the graph by using arrow keys.
- Scroll Up and Scroll Down the mouse wheel to zoom in and zoom out.
- Press Space to return to original domain.
- Press S to save your desired graph to history list.
- Reloading the saved graphs and switching light/dark mode and polar/retangular coordinates can be done by clicking the buttons on the sidebar.